Back to our work

About this project

LakeStats

Your lake, at a glance.

Water levels, trends, and open boat ramps for the lakes of the American West, free. Plus LakeStats Compass, a depth map of the lakebed drawn at today’s water level that keeps working where the signal doesn’t. On iPhone, Android, and the web.

Free to use. LakeStats Pro adds on-water tools for $39.99 a year.

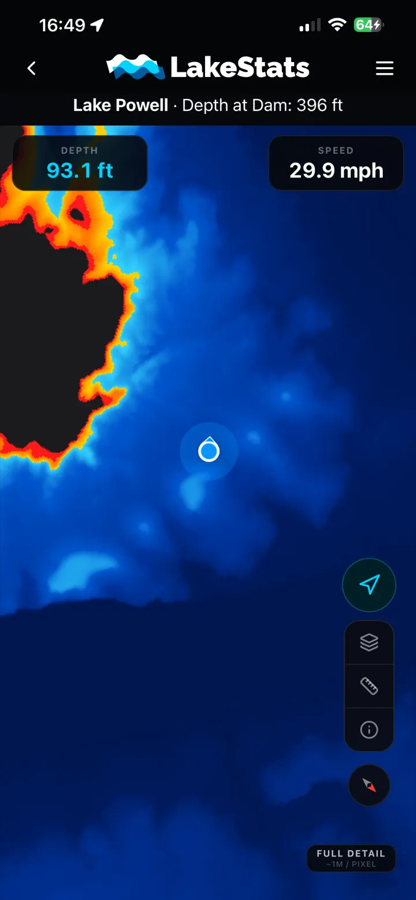
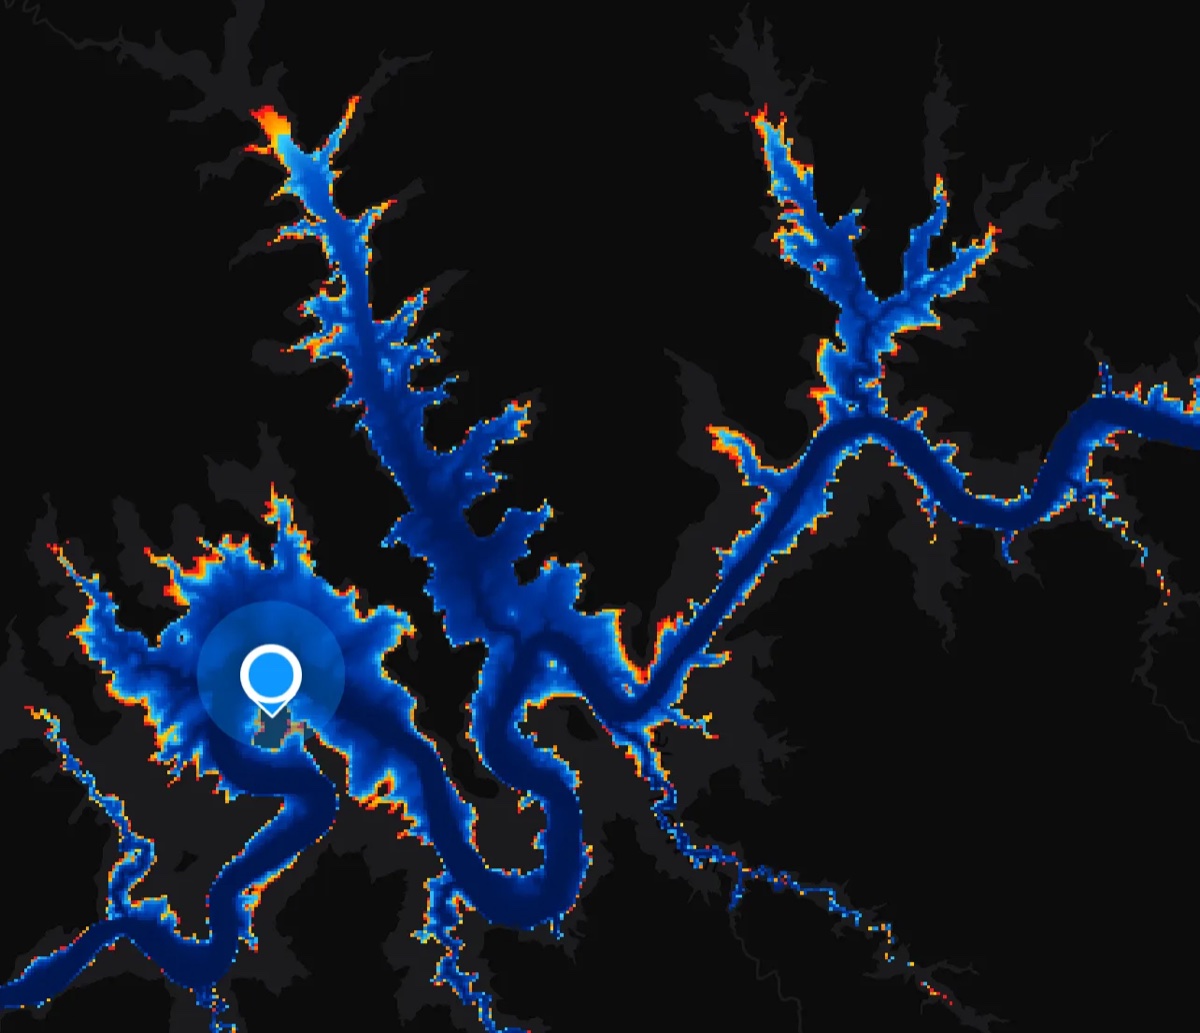
LakeStats Compass on Lake Powell: shallow water shaded red and orange, deep water blue, with the boat position, current depth, and speed on screen
water levels, graphs, ramps, and the depth map
Free
platforms from one codebase: iOS, Android, web
3
public agencies feeding the data
4
bars of signal needed on the water
0

Screenshots

What it looks like.

Dark by design, so it reads at the wheel in full sun and does not wreck your night vision after dark.

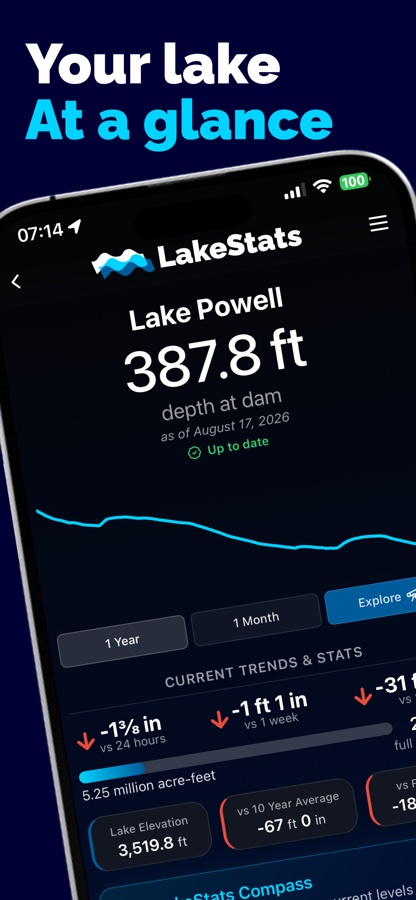
LakeStats lake dashboard for Lake Powell showing depth at dam, a one-year graph, and current trends
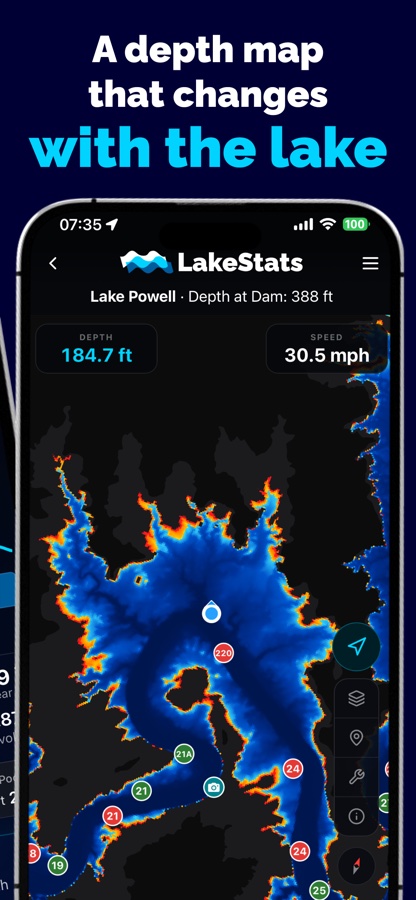
LakeStats Compass depth map of Lake Powell with the boat position, live depth, and speed
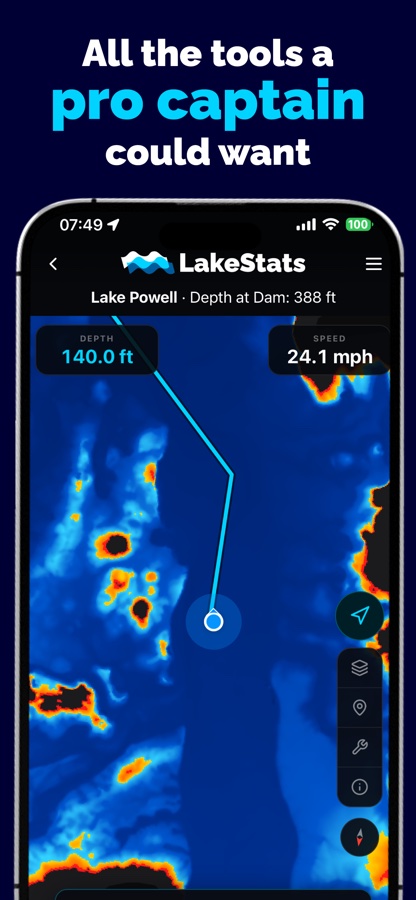
LakeStats Compass with a plotted route, live depth gauge, and speedometer
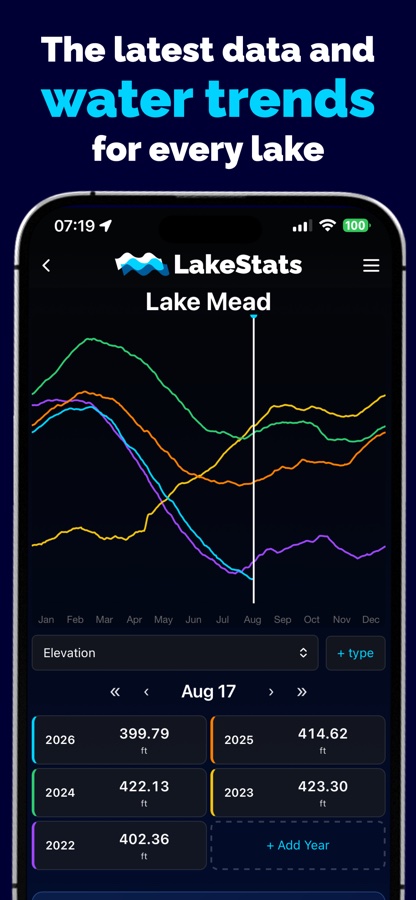
LakeStats water data explorer comparing five years of Lake Mead elevation on one graph
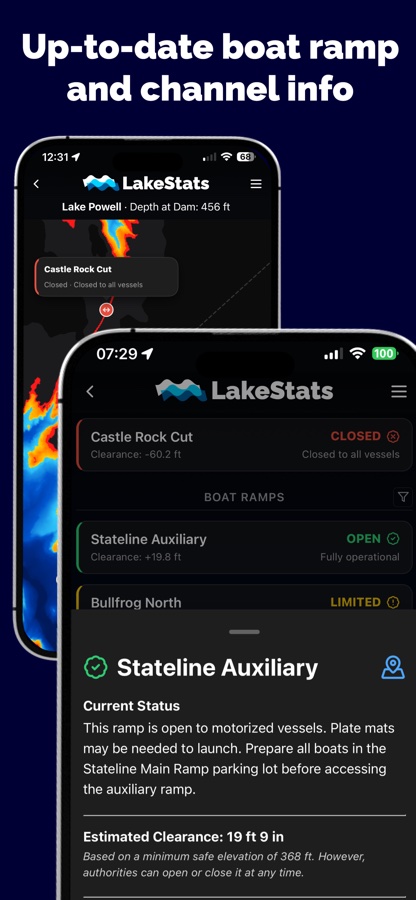
LakeStats boat ramp and channel status list with clearance estimates and a detail sheet
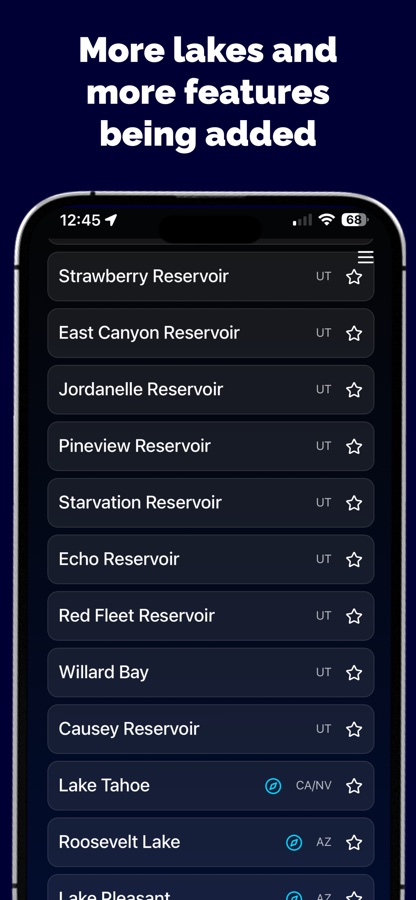
LakeStats lake list showing reservoirs across Utah, Nevada, California, and Arizona

LakeStats Compass

The map that changes with the lake.

Every reservoir drops and fills, and a chart printed last season does not know that. Compass redraws the bottom against the water that is actually there today, so the shallows you see are the shallows you will hit.

It is deliberately not a 3D flyover. At the wheel you need to know where it is deep, where it is shallow, and how close the difference is. Blue is deep, red is where the water runs out, and the boundary moves as the level does. Tap anywhere for the depth there, follow your own position with heading, and read live depth and speed off the top of the screen.

The whole map for a lake downloads before you launch, in tiers from lite to full detail, so it works twenty miles from a cell tower with the phone in airplane mode.

LakeStats Compass zoomed out over Lake Powell, the canyons of the lake shaded by depth against a dark background
Lake Powell in Compass. Bathymetry survey depth measured against today’s surface.

What it does

The data is free. The instruments are Pro.

Everything a boater needs to plan a trip stays free, including the depth map. LakeStats Pro adds the tools you use once you are on the water, and all of it works offline.

Free

  • Current water level for every lake, with change over 24 hours, a week, and a year
  • Percent full, storage, and comparison to the ten-year average
  • Historical graphs, and a data explorer that overlays years of elevation, inflow, and release data
  • Boat ramp and channel status based on what the managing authority actually reports, with clearance estimates
  • LakeStats Compass: a depth map of the lakebed rendered at today’s water level
  • Favorite lakes, and offline access to everything you have already viewed
  • My Spots: save a fishing hole or an anchorage and find it again from the water

LakeStats Pro

  • Live depth gauge and speedometer on the map
  • On-water routing and a measuring tool
  • Points of interest: marinas, beaches, canyons, campgrounds, fuel, and restrooms
  • Hazards and conditions reported by other boaters, dated so you know how fresh they are
  • Buoy positions as they are now, not as a printed chart remembers them
  • Weather and a seven-day forecast for the lake’s own coordinates
  • A Nearby sheet listing what is around you right now

Where it came from

Two Lake Powell apps became one.

Cedar Web Services spent several years building PowellPoint, a location-sharing and navigation app for Lake Powell boaters. In the same waters, LakeStats launched in May 2025 as a simple site that showed the current water level of a few lakes, grew into an iOS app that November, and in June 2026 shipped Compass, a free depth map that quickly caught on in Lake Powell circles.

The two teams reached out to each other, and in July 2026 formed LakeStats LLC. The features PowellPoint had been building became LakeStats Pro in August 2026. Cedar Web Services is a founding partner and leads engineering. Everything that was free before is still free today.

How it was built

Offline first, native where it counts.

Boaters are out of coverage most of the time they need the app, so the architecture starts from that constraint. The web codebase carries the interface, and the pieces that must be fast or must work with no signal are native.

React TypeScript Vite Capacitor Java Spring Boot Google Cloud Run Supabase Postgres Cloudflare Pages Cloudflare R2 MapLibre PMTiles Chart.js GitHub Actions

01

One codebase, three targets

The public site, the admin panel, and the mobile app are one React, TypeScript, and Vite codebase. Capacitor wraps it for iOS and Android. Build-time flags gate what ships where, so the web build never carries native-only code and the app never ships the admin panel.

02

A collector that scales to zero

A Java Spring Boot service on Google Cloud Run pulls readings from the Bureau of Reclamation’s HydroData and RISE catalogs, USGS gauges, and Salt River Project. Cloud Scheduler triggers it, it polls each source lightly, and it stops asking about a lake as soon as the day’s reading is in. Nothing runs when there is nothing to fetch.

03

Postgres, Edge Functions, and a migration in flight

Data lives in Supabase: Postgres for lake configuration, readings, spots, reports, and subscriptions, plus Edge Functions for the work that needs a server, like verifying App Store receipts. The platform started on Firebase and is being moved table by table without a user-facing cutover.

04

The depth map is a native layer

Compass renders on MapLibre through a custom native plugin rather than in the web view. Bathymetry surveys are processed per lake into tiled depth rasters and served from Cloudflare R2. The app downloads a lake in tiers before launch, then reads GPS, heading, and haptics from the phone directly, so the map keeps working in a canyon with the phone in airplane mode.
05

Rendered at today’s level, not last season’s

The lakebed does not change, but the surface does. Compass takes the current elevation from the collector and shades depth against it, so as the lake drops the shallows grow on the map the same way they grow on the water. A slider lets you explore the lake at other levels before a trip.

06

Reports that wait for signal

Hazards, conditions, and spots are written to the phone first. Anything created out of range is held locally and sent when the device is back in coverage, so a boater can flag a submerged rock the moment they find it rather than remembering to do it at the dock.

07

Accounts, subscriptions, and restore

Sign in with Google, Apple, or Facebook. LakeStats Pro is an annual subscription billed through the App Store and verified server-side, tied to the account rather than the device, so it restores anywhere the user signs in.

08

A release pipeline that boots what it ships

Staging and production deploy through GitHub Actions from a single release script that keeps the web and native version numbers in sync. Native builds must boot the exact bundle being archived on a simulator before anything is uploaded to a store, a gate added after a release once shipped without its backend configuration.

Try LakeStats

Free on iPhone and Android, and the water data is on the website with no account at all.

Need an app like this?

We build iOS, Android, and web apps that share one codebase, and the backends and data pipelines behind them. Directly for businesses, and as a white-label partner for agencies.

Start a conversation